Note: This opens a 219KB PDF file.
His question was:
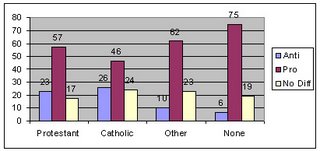
"I'd like to turn now to the issue of the adoption of children by gays and lesbians in Massachusetts. Recently, the Catholic Church has sought an exemption from a law that prohibits social service organizations from discriminating against gays and lesbians in adopting children. The Church argues adoptions by gays is immoral while the state argues that gays cannot be discriminated against." "Suppose candidates for Governor of Massachusetts took opposite positions on gay adoption. Which candidate would you be more likely to vote for ... ROTATE RESPONSES ... A candidate who opposes adoptions by gays and lesbians or a candidate who supports adoption by gays and lesbians or would that make little difference in your vote?"Of course, we have no way of knowing whether that will have any legs and be an issue in the coming campaign. However, it is fascinating to slice, dice and sauté the results on this question.
The survey took place this month. It asked a little over 500 (responses varied by question) likely voters. They were close enough to state demographic averages. For example, it got 48.7% Catholic/28.5% Protestant/8.0% Other/and 14.8% None of this question. The commonwealth in the last census was 47%/31%/6%/17%.
Likewise, they were just about on the average for political registration -- this question with 59.4% Democrats, 24.7% Republicans and 15.9% Independents.
There wasn't a single category in which a majority would vote for a candidate who opposed gay adoption, but in many, 50%, 60% or more would vote for the pro gay adoption one. Statewide, the figures were 21% for the anti, 54% for the pro, 22% for makes little difference, and 4% for don't know.
Of course, it wasn't that neat and even across the categories.
The simplest figures were in gender. Women clearly were for adoption. They were 14% for anti candidates and 63% for pro ones. Men were still solidly pro, 27% to 44%, but not nearly as strong.
 The anti-gay-adoption forces got their best results from a group with relatively small numbers of voters, African Americans. From another angle though, the Other racial category, even smaller in numbers than the African American grouping did tip 38% to 31% in favor of the anti-gay-adoption candidate. However, the populous voters swamped them 19% for anti and 55% for pro.
 The cliché for religion did not hold. Catholics were the anti-forces' strongest showing, but even here, the pro forces won 46% to 26% for anti.
 Less clear was age. As one might expect, the oldest voters, over 65, showed the greatest anti support at 35% to 31% pro. That actually was a pretty slim win. Interestingly enough though, the youngest voters, who normally are the loosest about gay-related issues were less pro than either the Boomer generation or the Gen-X folk. That may be another expression of their indifference to sexual-preference issues. It bears some watching in future surveys.
 For a final slice of this question, income had an odd dip. It was similar but less extreme than education. The trend in both was the poorer or less educated the voters were, the more likely they were to go with the anti-gay-adoption candidate. Yet in both, there was a dip at college graduate and $75-100K income and then the wealthiest and best educated group were slightly less in favor of the pro-gay-adoption candidate. That supports that the wealthiest voters tend to be very liberal or very conservative.
So, forget this was an election question. What seems clear is that the locals are pretty damned compassionate. They seem to strongly favor candidates of compassion rather than conservative ideologues.
Good on us.
And More: Do check out Charley's post and link to the latest poll showing 58% of Massachusetts voters onboard with same-sex marriage, over at Blue Mass Group. It has the extra goodness of snarky comments.
No comments:
Post a Comment